For SOC analysts, it is very important to know when a loss of logs is occurring or may have occurred. When SIEMs no longer receive logs from its usual sending hosts, the detection/correlation rules cannot be properly applied. It is then likely in this type of scenario, that there is a late awareness or even a total absence of awareness by the analysts if one or more security incidents could have occurred. The same is true if an attacker has managed to take control of a host or user account to stop all logging processes so that his illegitimate behavior goes unnoticed.
Artificial intelligence is seen as a very beneficial advance to our society, allowing us to predict our needs and thus respond with anticipation. Its ability to understand and analyze a given context can help detect anomalies or unusual behaviors and thus, can it strengthen the detection for the case of lost logs on hosts ? This is what we will discover in this article, which is broken down into five parts :
- Existing calculation methods
- Application of machine learning in Splunk with MLTK
- Limitations of detection with MLTK
- Another more classical and cognitive approach
- The advantages and disadvantages
Existing calculation methods
Considering the very negative effect that lost logs can have on the security of a company’s systems, it is essential to know how to detect them. There are three methods that can be used to solve this problem.
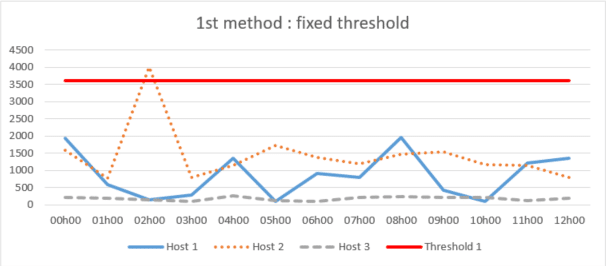
1st method: fixed threshold
This method consists in estimating and defining a fixed maximum time threshold for the non-receipt of logs globally or for each host. As soon as an entry exceeds the threshold, the alert is triggered.
This approach can be effective but the thresholds may not be accurately matched to the variation in host log appearance during certain periods, and therefore too high a tolerance may be applied or vice versa. This is an approach that ends up requiring critical analysis by analysts, so it is not as effective and reliable because it can trigger a lot of false alerts or ignore log losses where there should be none.
2nd method: standard deviation
The standard deviation method, which consists of calculating the variation in the appearance of logs around the historical average to define more precise automated thresholds in globally or for each host.
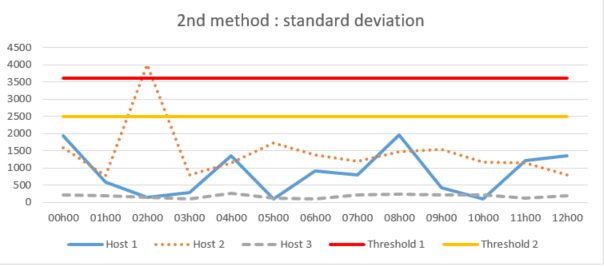
While this may seem to limit the problems arising from the first method outlined above, an effective limitation may occur when there is a trend or seasonality to the disappearance of logs from a host. The historical average will not accurately represent the true average for a given period of time and, as a result, the calculated thresholds may not properly detect possible log loss.
3rd method: the error of the standard deviation
The method of the error of the standard deviation which is similar to the previous one but which aims at calculating the forecast error allowing to obtain an average error. It allows to know several standard deviations for the definition of several thresholds for several periods for each host.
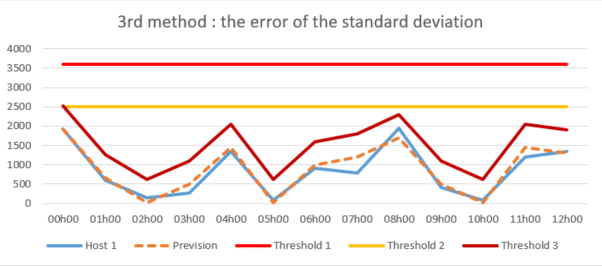
This smarter detection method analyzes the forecast error variance instead of simply monitoring the occurrence of logs around the historical average, and thus detects threshold overruns much more accurately and reduces them to a more plausible value. Therefore, this method is best suited to address the problem of log loss detection and can be directly employed and adapted through Splunk’s MLTK application.
Application of machine learning in Splunk with MLTK
What is MLTK?
Machine Learning Toolkit is a free application that installs on the Splunk platform to extend its functionality and provide a guided machine learning modeling environment with :
- A showcase with a machine learning toolbox. It contains ready-to-use examples with real datasets to quickly and easily understand how the methods and algorithms available work.
- An experimentation assistant to design in a guided way your own models and test them.
- An SPL search tab integrating MLTK’s own commands allowing you to test and adapt your own models.
- 43 algorithms available and usable directly from the application and also a python library containing several hundred open source algorithms for numerical computation in free access.
MLTK can therefore meet different objectives such as :
- Predict numerical fields (linear regression)
- Predict categorical fields (logistic regression)
- Detect numerical outliers (distribution statistics)
- Detect categorical outliers (probabilistic measures)
- Time series forecasting
- Clustering numerical events

Among the aforementioned objectives that MLTK can satisfy, only one machine learning model can address the detection of log loss with the error of the standard deviation method: outlier detection.
Outlier detection for missing hosts
Outlier detection is the identification of data that deviates from a data set. To obtain the data in this use case, it is sufficient to record the time difference between each log issued by the host and to clean the null values that may distort the results. Then, we calculate the error of the standard deviation for each of the data to detect the outliers.
Here is an example of a prediction model in MLTK on log loss for a single host. The outliers (yellow dots) are the data points that fall outside the outlier envelope (light blue area). The value on the right side of the graph (14) indicates the total number of outliers :
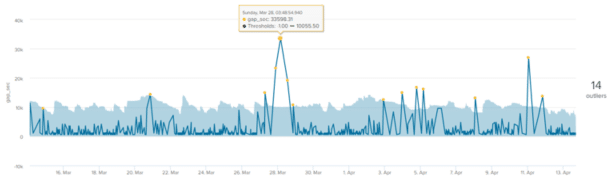
We notice that the outlier envelope or the calculated thresholds follow rather well the general shape of the curve but that a certain number of outliers are still found.
Limitation of detection with MLTK
While this method allows for the seasonality of log loss, it still requires some consistency. Some hosts may transmit very irregularly during any period and thus create false outliers in the data sets.
For example, this is the case for this host which, over a period of 2 to 30 days, will keep a high coefficient of variation. This coefficient corresponds to the relative measure of the dispersion of the data around the mean : It is equal to the ratio of the standard deviation to the mean. The higher the value of the coefficient of variation, the greater the dispersion around the mean. Below, the coefficients of variation are greater than 1.5, i.e. the standard deviation is more than 1.5 times the mean. A standard deviation is considered to be high when it is half the mean, so it is relatively high in this example:
| Periods | 2_days | 7_days | 14_days | 21_days | 30_days |
| Total Frequency | 144 | 404 | 902 | 1338 | 1921 |
| Total Population (xf) | 258591 | 688776 | 1295373 | 1900168 | 2653629 |
| Median (μ) | 600 | 600 | 600 | 600 | 600 |
| Average (ⴟ) | 1795.77 | 1708.09 | 1436.11 | 1420.16 | 1381.38 |
| x min | 598 | 580 | 559 | 559 | 559 |
| x max | 28799 | 28799 | 31199 | 37204 | 37204 |
| Standard Deviation (σ) | 3301 | 2869 | 2416 | 2446 | 2304 |
| Coefficient of variation | 1.84 | 1.68 | 1.68 | 1.72 | 1.67 |
The same is true if you focus on specific days of the week over a 30-day period:
| Periods | Monday | Tuesday | Wednesday | Thursday | Friday | Saturday | Sunday |
| Total frequency | 403 | 403 | 356 | 328 | 268 | 90 | 73 |
| Total population | 431224 | 407397 | 344989 | 346248 | 390887 | 383993 | 386387 |
| Median | 600 | 600 | 600 | 600 | 601 | 2104.5 | 3000 |
| Average | 1070.03 | 1010.91 | 969.07 | 1055.63 | 1318.62 | 4266.59 | 5292.97 |
| Minimum value | 595 | 559 | 580 | 592 | 594 | 590 | 598 |
| Maximum value | 7200 | 7200 | 8400 | 10800 | 8399 | 37204 | 31199 |
| Standard deviation | 988 | 835 | 794 | 1056 | 1379 | 5771 | 6871 |
| Coefficient of variation | 0.92 | 0.83 | 0.82 | 1.00 | 1.05 | 1.35 | 1.30 |
Moreover, for entries that are very verbose, a performance demand on the SIEM side is also important during the different calculations because of a too large number of logs. It is then necessary to reduce the learning period of the model, thus impacting the reliability of the calculated thresholds, because the longer the learning period, the more data it allows to store and therefore to predict better thresholds.
Finally, it is very difficult with this solution to apply this model to a set of hosts. Each input emits logs in its own way and it is therefore mandatory to adjust the calculations for each input for this model to work correctly. This case-by-case adjustment can be a considerable workload if several hundred or even thousands of hosts need to be monitored.
Another more classical and cognitive approach
Observing that the cognitive solution can detect threshold violations much more precisely and at more plausible values, it is no less restrictive. Indeed, this solution requires a certain regularity in the data, a long learning period and thus a significant computing power and the ability to refine the calculations on a case by case basis.
To overcome these different constraints, another approach, more classical and based on the idea of a cognitive solution, was thought and designed for a general application on a set of hosts.
It consists first of all in relying on the counting of events rather than on the calculation of the time difference between each event. This change of parameter is very important because even if the type of data is not the same, the computational power required is much less important and thus allows a longer learning period.
This model then performs statistics to apply a minimum threshold for each host based on their verbosity level over several time slots. Coefficients are then applied to these thresholds based on the variation in values that may have been measured in the past in order to refine and obtain a specific threshold for each host at a specific time. Although this way of calculating thresholds can be considered more arbitrary, it is no less accurate than the machine learning method. In addition, it allows you to keep control of the log loss tolerance and to refine the thresholds on a case-by-case basis for a set of hosts.
The advantages and disadvantages
All current systems generate event logs, the volume of which varies over time (notably according to their activity) which creates a certain variability. As a result, there is no completely reliable method of detecting log loss. Regardless of the nature of this variance, many external factors can occur that can severely affect the reliability of the method used. Log losses are often the result of external events, such as collection agent or transmission API malfunction, machine decommissioning or reboots, which may be due to infrastructure, system or software constraints that temporarily make log collection impossible.
Even if machine learning is in the news a lot at the moment because important progress has been made in this field and it could have been a good axis of improvement to answer this problem. The way it is presented often leads us to believe that it is capable of answering any problem as long as a context has been well defined and there is the presence of data. But this is obviously not the case. Although machine learning allows to increase detection rates, to detect attacks as early as possible and to improve the ability to adapt to changes, machines are constantly learning.
In most cases, machine learning is a clever combination of technology and human intervention. For this reason, the more traditional approach better fits the context of this use case. Indeed, whether with MLTK or another machine learning solution, it is difficult to predict the data and to obtain acceptable confidence thresholds for each host because of the large variability that remains between them.